🏅 School Reading Leaderboard
Every year, my school runs a reading challenge for students in Year 7 & 8.
For 2024, the Librarian asked me if I could build a dashboard, allowing students and parents to check in on who was winning from home!
I would like to have a website/page that could keep track of the Reading Challenge Progress and provide “live” updates. I know they wouldn’t be live but perhaps we could update them at the end of the day and provide a link in the newsletter so students and parents can see how each tutor group is performing. Something fun (remember it’s aimed for Y7) and maybe interactive??
What do you think?
After receiving the initial email, we had a quick meeting to expand on the idea.
I love Eleventy (11ty). It's what this website's built on, and it ticks all my boxes:
- Forgiving
- Easy to use
- Free to host (using Netlify!)
As a result, I knew immediately I wanted to use it in this project, especially as the data wouldn't be updated immediately.
I also like using Airtable as a backend system. It's got a decent API, and it's pretty easy to bring the data into Eleventy, and use it from there.
I suggested both of these, which the Librarian was very happy to use - we agreed that the data didn't have to be updated instantly, so going for a static site system would be fine (both for efficiency and cost reasons.).
I settled down to begin designing the system:
I decided to use the Hylia starter, as using a template would significantly reduce the time it took me to build the site.
I really liked the design, and after tweaking the colour scheme, decided it would fit well!
I then set about building the Airtable base for the project.
The data would be recorded per tutor group, with the leaderboard displaying which group had read the most books.
I would share access to the base with the two Librarians, who would then be able to go in and update the statistics for how many books had been read by each group.
The system would then calculate the totals, and display them on the site.
When I logged in, I found that Airtable had just released a new feature called 'Interfaces'.
This was perfect, as it would make it really easy to build a custom backend interface for the librarians to use. Thank you Airtable!
I first created an Airtable database, and then built the interface around it.
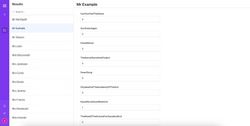
The Librarians were both really happy with the interface, so I set about connecting it to the frontend.
I built the fun podium, with 11ty extracting the data from the airtable and using it to fill out the podium.
I also added the profile photos of the staff members, to add a bit more fun to the site.
Underneath this, the runners up were then listed.
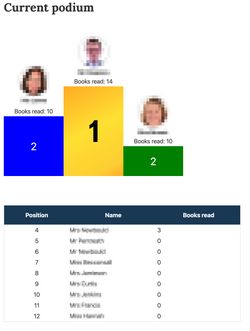
After recieving feedback from others within the school, I removed the images & runner-up table.
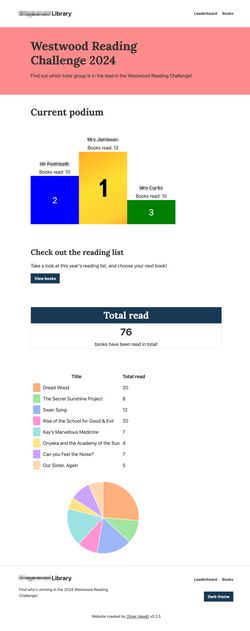
However, this coincided with the completion of another feature I'd been planning - book stats!
I used charts.js to generate a pie chart, detailing which book had been read the most. It was colour coded, and I picked a pastel-colour scheme that would brighten the site, and make it even more exciting for 11 & 12 year olds.
This used the same data from Airtable, and then inserted it into the table.
The Librarian was a huge fan of this, and so we introduced it into the next version of the site!
Final product
The site was now ready for launch, and data had been fed into the system.
The link was shared to parents & students, and the site refreshed every day at 6pm.
I'm really proud of this project on a number of levels, especially as it was my first 'commissioned' website! I'm also pleased with the rapid turnaround - the site was online within 2 weeks our inital conversation!
March 2024